

This post is inspired by the chapter "Introducing Player Involvement Metrics" from Stephen M. Shea's book "Basketball Analytics. Objective and Efficient Strategies for Understanding How Teams Win". In this chapter, Shea challenges us to consider how production is distributed among players on the court, whether it’s points, rebounds, assists, or other aspects of the game. Is it better to have a balanced distribution where all players score, or to rely on one or two elite scorers while others focus on facilitating the game for the stars?

To analyze the distribution of points, Shea uses Shannon's entropy formula to calculate the distribution of each team, where the sum is over all players on the team.
h(PT)=-∑pi·log2(pi)
The more players score points and the more evenly those points are distributed among them, the higher the team's h(PT) will be. In addition to h(PT) (points distribution), the distribution of minutes, rebounds, and assists (h(Min), h(DR), and h(AS)) have also been calculated.
By relating h(PT) and h(Min), we measure how much the scoring is shared among the five players on the court, regardless of the number of players the team rotates and their playing time. Thus, we calculate the "Point Balance" (PB).
PB=h(PT)/h(Min)
"Assist Balance" (AB) and "Rebound Balance" (RB) are defined similarly to PB, points are replaced by assists and rebounds, respectively.
Shea's conclusions after analyzing NBA data from the 2006-07 to 2012-13 seasons (regular season games) as follows:
h(PT) and h(Min) are highly correlated (R2: 0.80). In other words, the more evenly minutes played are distributed, the more evenly points scored will be distributed.
The most interesting information is revealed when comparing PB with the win percentage (W%). It is observed that all team with low PB (less balanced) have been successful. No team with a PB below 0.93 won less than 40% of their games. The panorama can be summarized by saying that there are many ways to win, but only one way to lose.
Like the data on PB, the data on RB and AB suggest that an unbalanced distribution is favorable.
In this post, we will perform the same analysis using data from the last 7 seasons of Euroleague (Regular season data).
Note: In the 2021-22 season, Russian teams were excluded from the Euroleague, due to the war. The 2019-20 season was suspended due to Covid, and the 28 played rounds in that season have been considered.
Let's analyze the data!
In Figure 1, we analyze the relationship between the distribution of points and minutes (h(PT)-h(Min)), and we observe a significant correlation (R2: 0.83 and P-value < 0.0001). This indicates that, similarly to the NBA, the more evenly minutes are distributed, the more evenly points scored are distributed.

The h(DR)-h(Min) graph has a similar shape to the Figure 1 (R2: 0.80). However, the correlation of h(AS)-h(Min) is moderate (R2: 0.50).
In Figures 2, 3, and 4, we analyze the relationship between the balance indices (PB, RB, and AB) and W%.
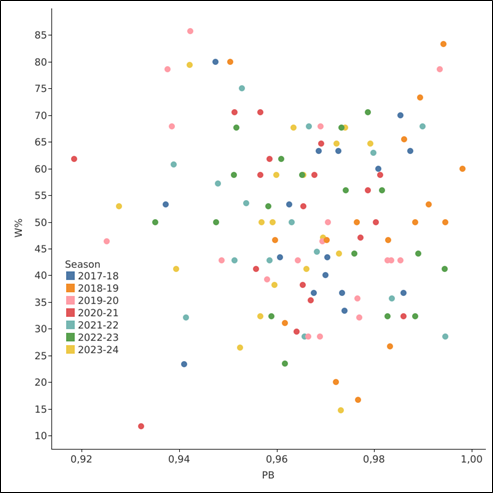
In the case of PB (Figure 2), we do not find a clear correlation with W%, suggesting that how points are distributed in a team does not necessarily correlate with its success in terms of wins.

For RB (Figure 3), the conclusion we draw is the same as the PB, the distribution of defensive rebounds in a team is not correlated with the team’s success.

Similarly to PB and RB, no definitive conclusions can be drawn from Figure 4 (AB-W%).
As a brief conclusion we can say that analyzing how production is distributed in different areas of the game in Euroleague, there are many ways to win and lose. That is, having a less balanced point distribution like Barcelona of the 2019-20 season (PB: 0.94, W%: 78.6%, Mirotic has a lot of impact on points scored) or a more balanced point distribution like Fenerbahce of the 2018-19 season (PB: 0.99, W%: 83.3%) can lead to a high W%.
Conclusions
These are the main conclusions drawn from this analysis:
Analyses conducted in the NBA are not directly applicable to other leagues. The conclusions drawn by Shea in his book differ from the conclusions of this analysis. For each league a specific analysis is needed, as each league has different realities and trends, which can have little or nothing to do with those of the NBA or Euroleague.
As a conclusion we can say that analyzing how production is distributed in different areas of the game in Euroleague, there are many ways to win and lose. Teams built very differently can achieve similar results.
It is a type of analysis that can help when forming the squad, as it can give us clues to the keys to forming a winning team.
At Basketball Analytics Lab, we offer data analytics services to clubs, enabling them to enhance their performance without significantly increasing their budgets.
Feel free to share and comment if you found this article interesting.
Where Data Meets the Hoops - Let's Analyse the Game Together!