

Exploring Competitive Dynamics Across European Basketball Leagues

The ecosystem of European basketball leagues is incredibly diverse, with each league boasting its own unique characteristics. This diversity poses a challenge when attempting to compare players or teams across different leagues.
The objective of this post is to identify which leagues exhibit competitive balance and which may not be as evenly matched. To achieve this, we have analyzed games from the 2023-2024 season (games played up to March 15, 2024) across six European leagues:
ABA (Adriatic League)
BBL (British Basketball League)
ESAKE (Greek Basketball League)
LEGA (Italian Basketball League)
LKL (Lithuanian Basketball League)
PRO A (French Basketball League)
In our quest to identify parity within these leagues, we will focus on analyzing the Net Rating of each game in absolute terms.

In case any metrics seem unfamiliar, you can find their descriptions in our glossary.
Let's start by analysing the Gladiators from a team perspective!
Results
Our journey begins with histograms depicting the distribution of Net Ratings in absolute values. However, instead of the traditional approach of counting the number of games within each Net Rating range, we opted for a nuanced methodology. Recognizing the inherent variability in the number of games played across leagues, we pivoted to a percentage-based analysis. This allowed us to compare the relative frequency of games falling within different Net Rating ranges, offering a more insightful perspective on competitive balance.
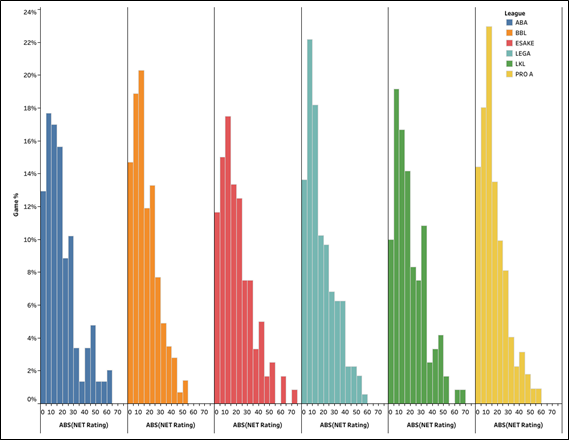
The resulting graphs revealed intriguing patterns. While the shapes of the histograms exhibited a degree of similarity across leagues, notable deviations emerged. Some leagues—such as PRO A, LEGA, and BBL—showcased a higher concentration of games with lower Net Ratings. This suggests a greater level of parity, with a significant proportion of matchups culminating in closely contested battles.
To quantify this observation, we defined "close games" as those games with a point differential of 10 or less, corresponding to a Net Rating of approximately 15 (considering games of approximately 70 possessions). We analyzed the percentage of games with Net Rating equal or lower than 15. The results obtained are as follows, ordered from the highest percentage to the lowest:
PRO A: 55.4%
LEGA: 54.0%
BBL: 53.8%
ABA: 47.6%
LKL: 45.8%
ESAKE: 44.2%
Analyzing the prevalence of close games across leagues, PRO A emerged as the most competitive, closely followed by LEGA and BBL. These leagues, characterized by a higher frequency of tightly contested matchups.
Conversely, we explored the phenomenon of "blowout games," defined as those with a point differential of 25 or more, corresponding to a Net Rating of approximately 35 (considering games of approximately 70 possessions). We analyzed the percentage of matches with Net rating equal or higher than 35. The results obtained are as follows, ordered from lowest percentage to highest:
BBL: 8.4%
PRO A: 9.0%
LEGA: 13.1%
LKL: 13.3%
ABA: 14.3%
ESAKE: 15%
Here, BBL and PRO A emerged as outliers, boasting the lowest percentage of blowout games among the six leagues analyzed. This underscores the resilience of teams within these leagues, where lopsided victories are a rarity rather than the norm.
Conclusions
PRO A, BBL, and LEGA emerge as the most competitive leagues, characterized by a higher frequency of closely contested matchups. However, this does not indicate that these leagues are of higher level than others.
For instance, if we look at the Greek league (ESAKE), we observe that it is the least balanced leagues among those analyzed. However, within this league, we find two of the top teams in the European landscape, Olympiacos and Panathinaikos. The results obtained suggest that there is a significant disparity between teams in ESAKE. It does indicate that the statistics of non-equal leagues need to be analyzed more carefully, as there is a higher probability that certain players/teams will skew their stats in some matches.
All of this should be considered by teams when recruiting. Data analytics can become an important tool in the recruiting process, but let's not forget that it always must be complemented with player observation.
At Basketball Analytics Lab, we offer data analytics services to clubs, enabling them to enhance their performance without significantly increasing their budgets.
Feel free to share and comment if you found this article interesting.
Where Data Meets the Hoops - Let's Analyse the Game Together!