

Finding Stability: When Early-Season Basketball Analytics Start to Matter

The 2024-25 season is upon us, and it's time to delve into a key question for basketball data analytics enthusiasts: when can we start analyzing team efficiencies with meaningful results? When does the data volume become large enough to ensure our conclusions are reliable?

To tackle this, we’ve examined data from the 2023-24 LEGA season, specifically focusing on how OER, DER and 3-point percentage fluctuate from game to game for each team in the league. This kind of analysis can be applied to any metric, whether you're evaluating teams or individual players.
Now, let's dive into the findings.
In the image below, we chart the running average of the mentioned metrics as the season progresses. Each line represents a different team's data.
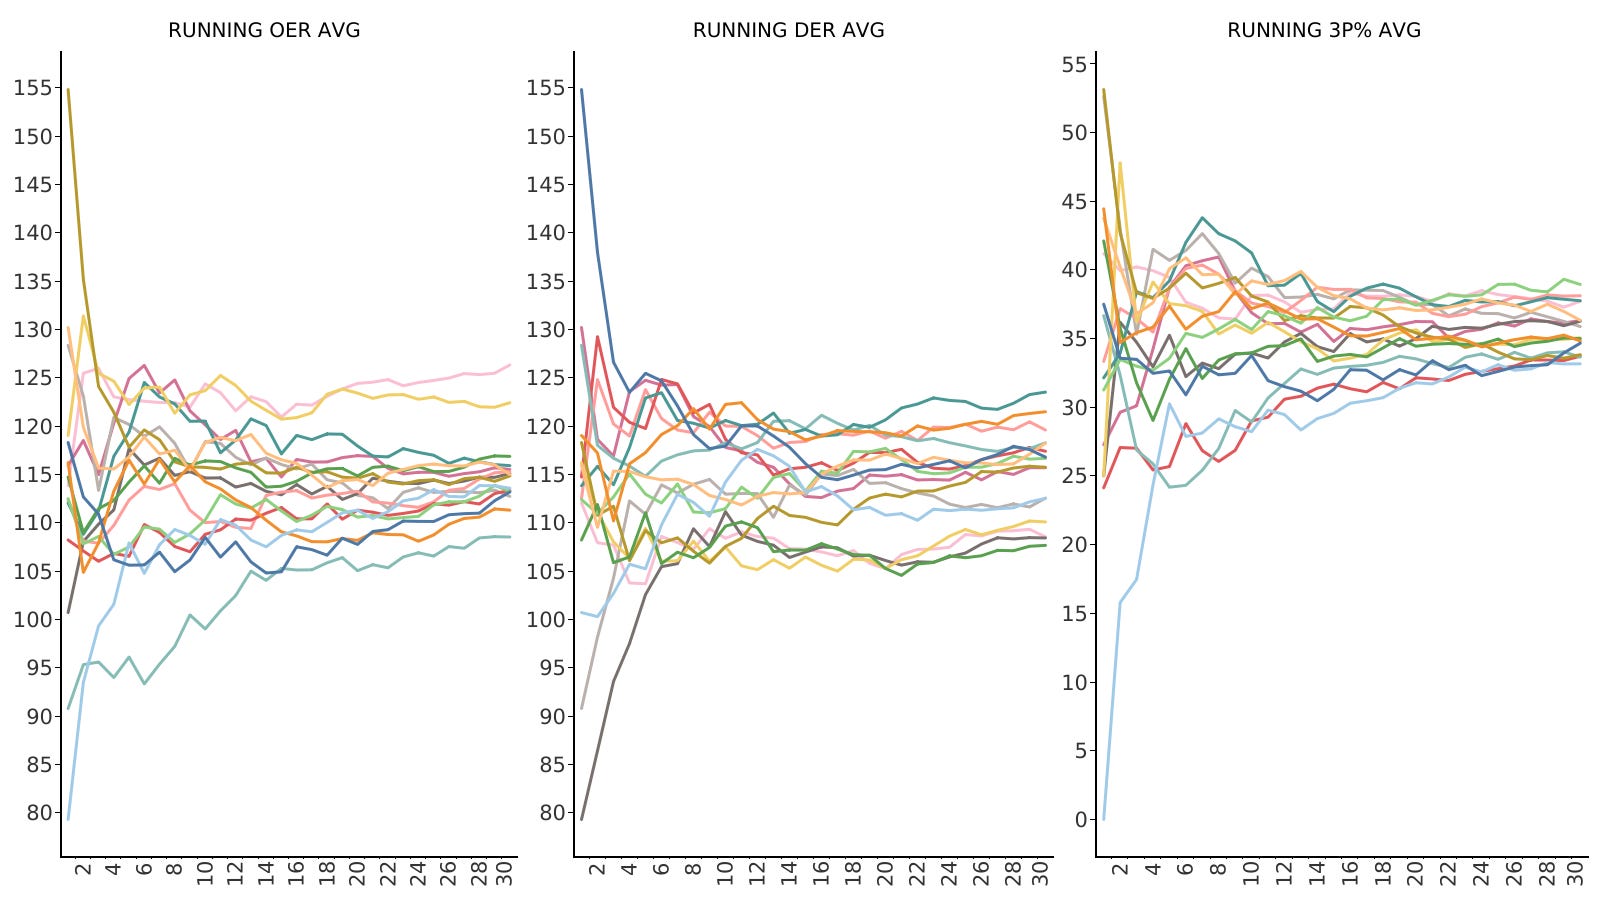
As games accumulate, you'll notice that these metrics begin to stabilize. But to quantify this stability, we’ve also measured the change in these averages from one game to the next. Unsurprisingly, the early-season numbers show much more volatility than the late-season data. Let’s break down this variability for each LEGA team.
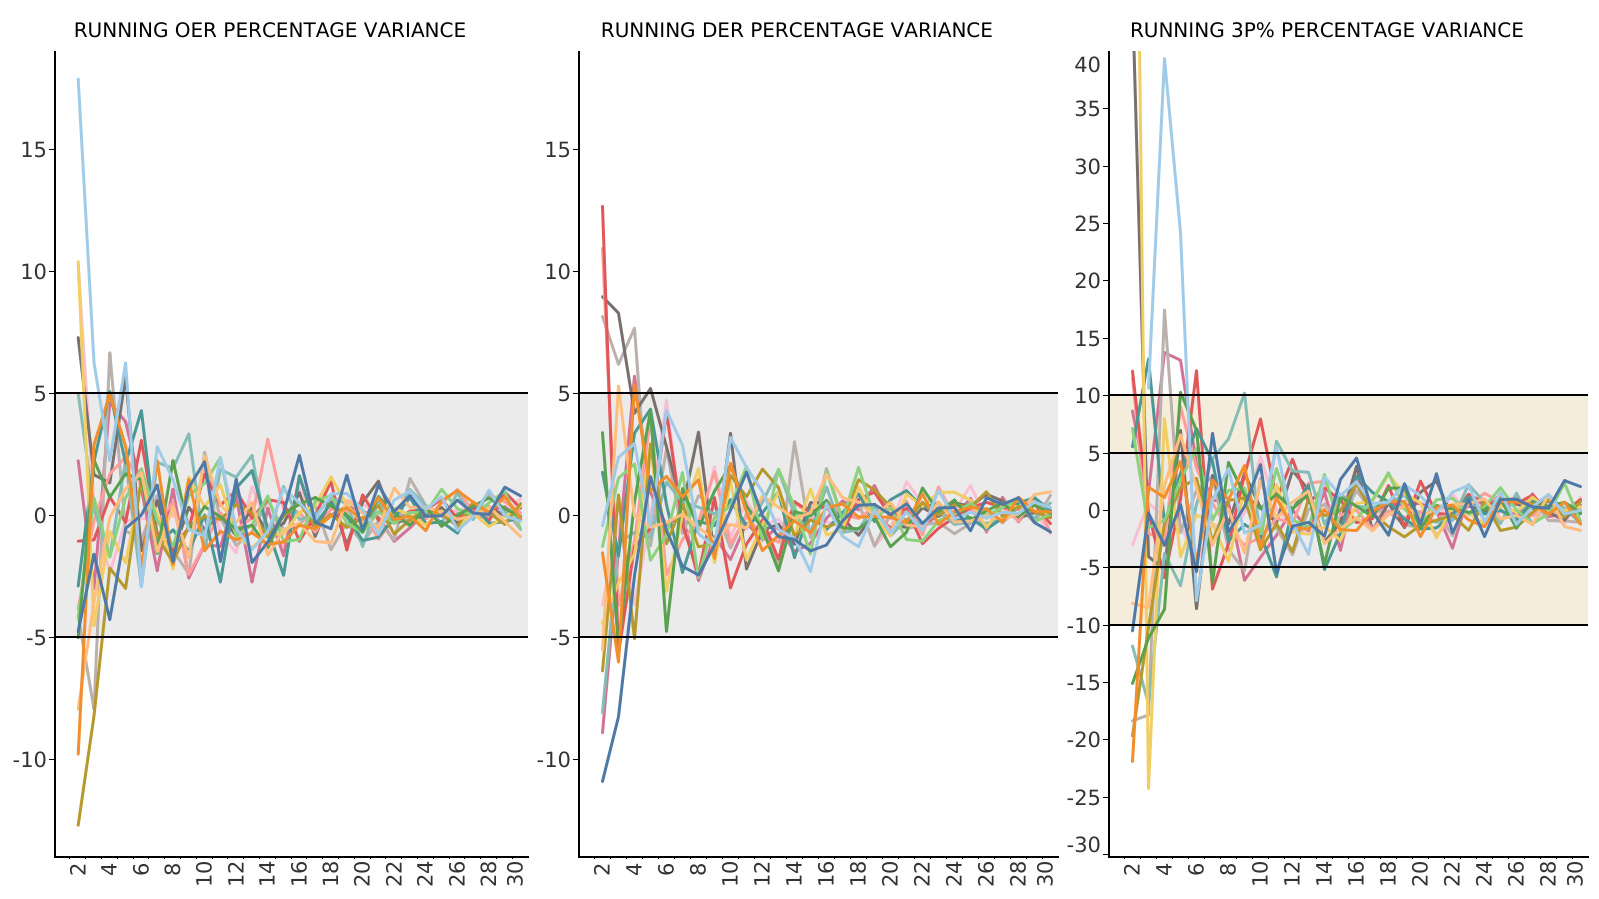
What we find is that for OER and DER, the cumulative average stabilizes to within a 5% variation after just five games. When it comes to 3P%, it takes a little longer: by Game 6, the variation drops to below 10%, and by Game 11, it’s within 5%.
Taking this analysis a step further, we can say that after roughly 360 possessions, a team’s efficiencies—both offensive and defensive—settle into a consistent pattern (with less than 5% fluctuation). For 3-point shooting, around 160 attempts are needed for the accuracy percentage to stabilize within a 10% margin, and approximately 300 attempts are required for the margin to shrink to under 5%.
This type of analysis is crucial for determining when it makes sense to start evaluating teams or players with confidence. When analyzing individual players, supplementing early-season data with stats from previous seasons can provide a more robust sample size for drawing meaningful conclusions.
At Basketball Analytics Lab, we offer data analytics services to clubs, enabling them to enhance their performance without significantly increasing their budgets.
Feel free to share and comment if you found this article interesting.
Where Data Meets the Hoops - Let's Analyse the Game Together!
This is a really helpful analysis! This type of information can help teams know when they should reevaluate their team to know if any structural (roster and/or coaching) changes are needed.
It's interesting that it happens so fast. In my work (dealing with American football) it takes better than half of the season (11 games is the generally accepted norm) for stats to crystallise. Due to the NFL's extremely limited sample size, it takes much longer (relative to season length) for everything to come into focus.
I honestly wonder if it'd help a sport like basketball if things took a little bit longer to settle, because most of everything that happens after November kind of feels like waiting, except for maybe a big game here and there that people want to see, but it's also not a culture like baseball has, where individual games never mean anything ever, and everybody knows it, so waiting is the whole point of the sport.
There's obviously no possible way to make this true, but imagine an NBA where we were at the 50 game mark before teams' identities were finally settled. It sounds pretty fun to me.