


The Evolution of Midrange Shots in the Euroleague: Analyzing Geographical Shifts and Efficiency Metrics

In the book, Sprawlball, Kirk Goldsberry examines the changing landscape of the NBA, emphasizing the spatial dynamics that influence shot selection and efficiency. Inspired by Goldsberry’s analysis, we delve into the geographical evolution of shot distribution in the Euroleague, spanning from the 2008-09 season to the present 2023-24 campaign. This exploration provides a comprehensive view of how the Euroleague's shot geography has shifted, particularly focusing on the midrange shot.
 - Eurohoops")
Analyzing Shot Density and Efficiency Over Time
To begin, let’s consider the overall shot attempted density changes between the 2008-09 and 2023-24 seasons (see Figure 1). It is worth noting the change in the court that made in the 2010-11 season, when the three-point line was moved back to 6.75 meters.
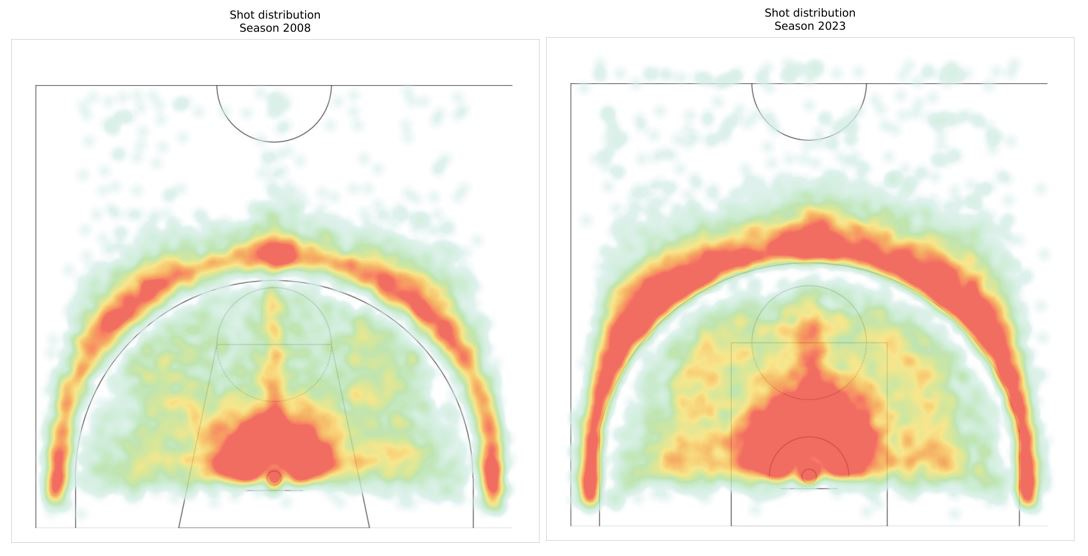
Figure 1 illustrates that the zones with the highest shot densities (represented in red) have grown, particularly in the three-point region and the restricted area (close-range area). Although the difference between the two seasons is not significant.
Examining the efficiency of these shots, Figure 2 contrasts points per shot (PPS) by locations over the same periods.
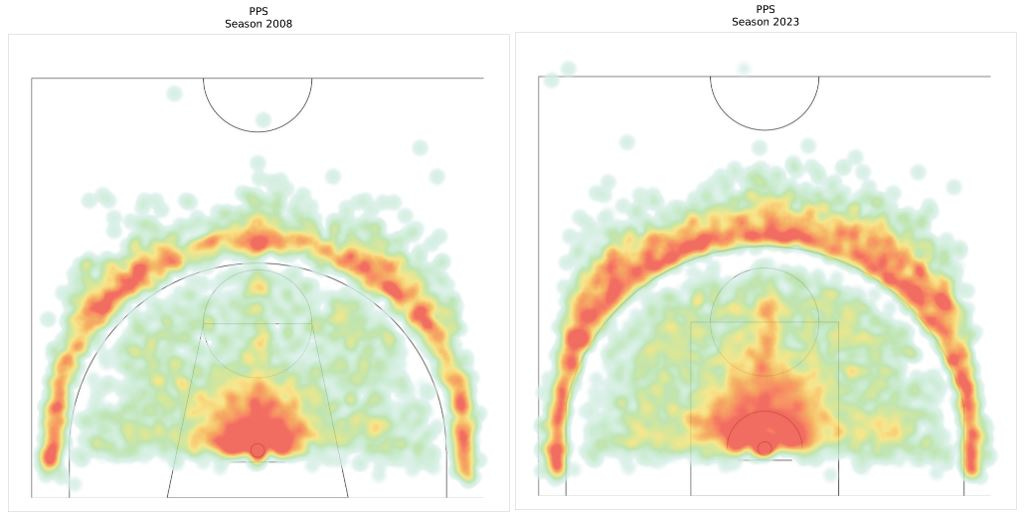
The findings from Figure 2 align with those in Figure 1. The efficiency, represented by a growing red area, improves noticeably in the three-point and restricted zones. However, these changes are subtle.
Delving deeper into the 2023-24 season, Figure 3 provides a nuanced view of PPS as a function of shot distance.
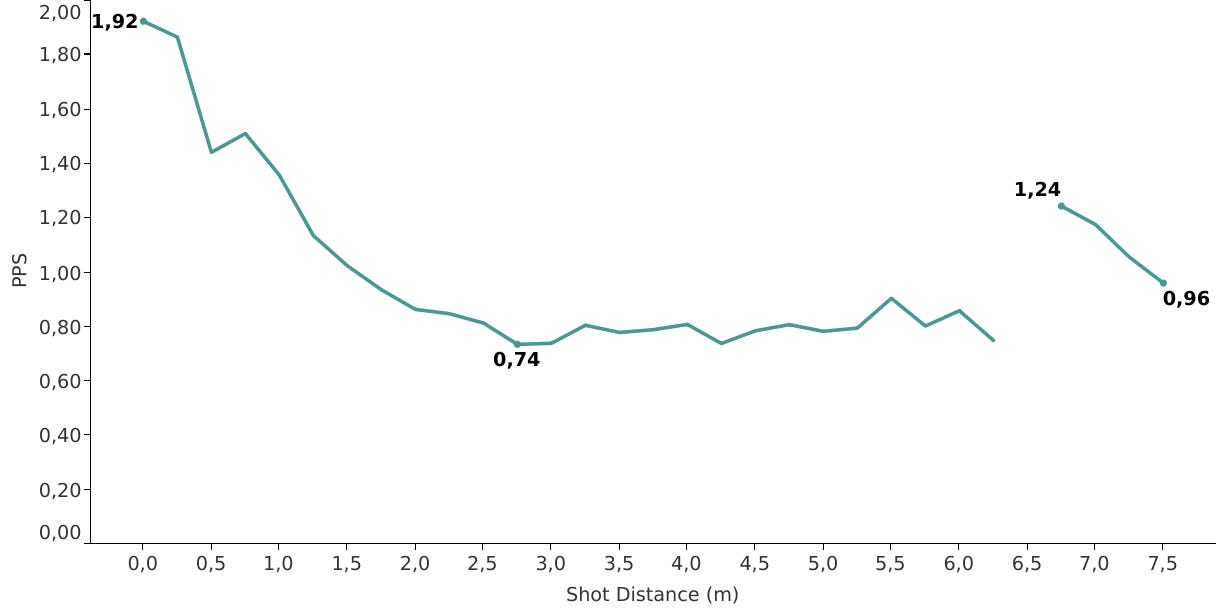
PPS decreases with distance from the hoop until the three-point line, where efficiency spikes to favorable levels. This pattern underscores the inherent inefficiency of midrange shots. There is no formal definition of midrange, and in this case, we have defined midrange areas as two-point locations between 2.44 meters (8ft) from the basket and the three-point line.
The Decline of Midrange Shots
Goldsberry’s analysis in Sprawlball shows how the use of midrange shots has evolved over recent seasons. In Figure 4, we compare the percentage of midrange shots taken in the Euroleague and the NBA.
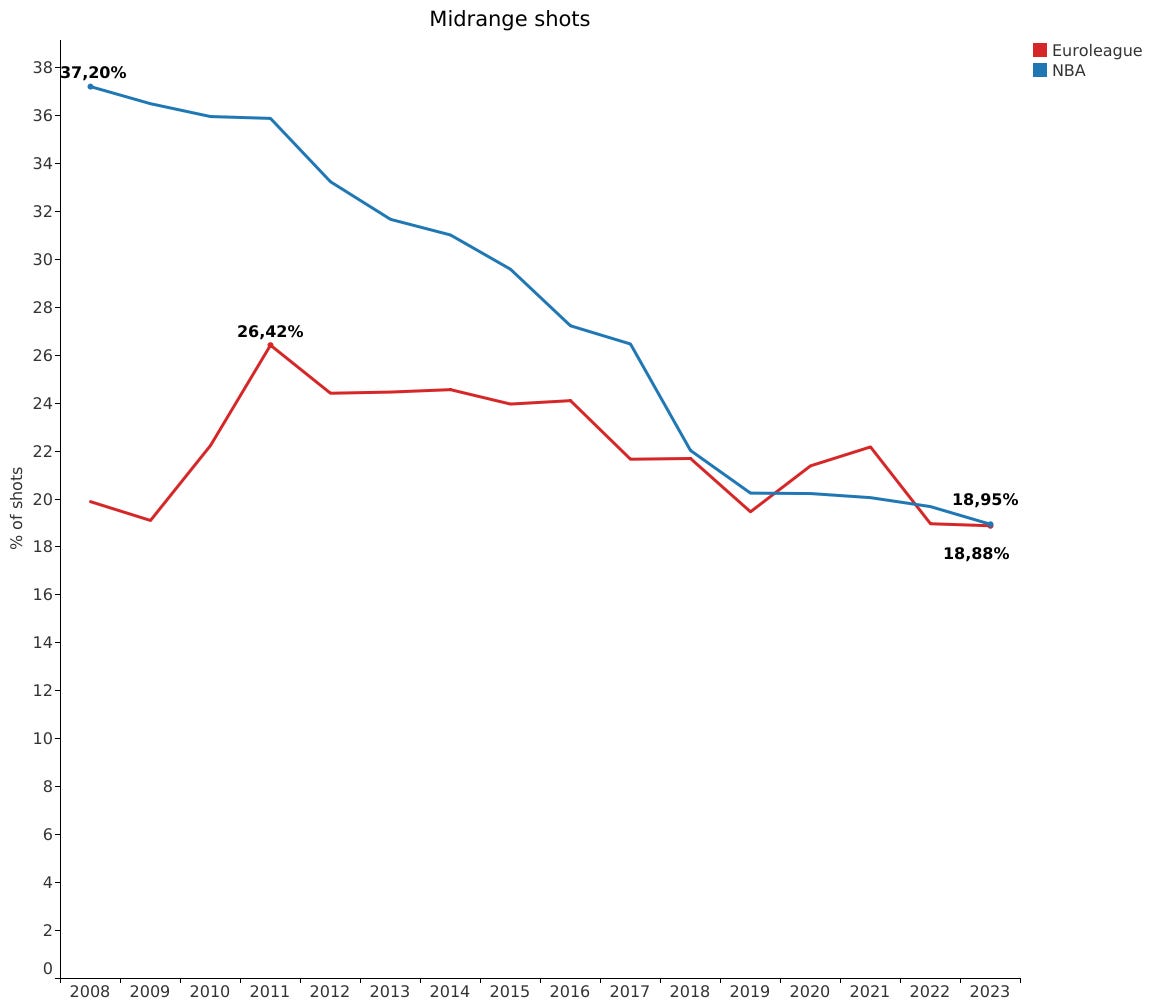
We observe that in the 2008-09 season, the percentage of midrange shots in the Euroleague was very low (19.89%), while in the NBA it was considerably higher (37.20%). As the seasons progressed, the two leagues have reached almost identical values over the last six seasons. While the values in the Euroleague have remained relatively stable, the percentage of midrange shots in the NBA has been decreasing. The Points Per Shot (PPS) has remained very stable at low values both in Euroleague and NBA, around 0.75 (as we said previously, the less efficient area for shooting).
Typically, the NBA sets the trends in gameplay, but in this case, the Euroleague adopted lower midrange shot percentages before the NBA did. This might be due to the smaller dimensions of FIBA courts, which make it even more challenging to take clear shots from this area.
Top Performers of 2023-24
Despite the general inefficiency of midrange shots, certain players can shoot efficiently from this area. Filtering for those with at least 25 midrange attempts and a PPS above 1.1, we identify the following standout performers:
Tarik Biberovic: 1.21 PPS
Matt Costello: 1.19 PPS
Leandro Bolmaro: 1.15 PPS
Edwin Jackson: 1.13 PPS
Luka Mitrovic: 1.11 PPS
Tamir Blatt: 1.11 PPS
These players demonstrate that while the midrange shot is generally inefficient, it remains a valuable weapon for those who can master it, although there are not many players in Euroleague.
At Basketball Analytics Lab, we offer data analytics services to clubs, enabling them to enhance their performance without significantly increasing their budgets.
Feel free to share and comment if you found this article interesting.
Where Data Meets the Hoops - Let's Analyse the Game Together!