Dean Oliver's "4 Factors" Explored
Analysing the impact of "4 factors" on basketball performance across different leagues and seasons.
Dean Oliver’s "4 Factors"1 are widely known in basketball data analytics, offering insights into team performance through access to the boxscore. In this post, we'll delve into how we work with the "4 Factors" at Basketball Analytics Lab.
In every basketball game, we don't just have "4 Factors" but "8 Factors" – 4 for Team A and 4 for Team B. At Basketball Analytics Lab, we convert these "8 Factors" back into 4, making analysis more straightforward. How do we achieve this? We work with net metrics instead of handling offensive and defensive metrics simultaneously.
Net_eFG% = eFG%_TeamA - eFG%_TeamB
Net_Off.R% = Off.R%_TeamA – Off.R%_TeamB
Net_TO% = TO%_TeamA - TO%_TeamB
Net_FTR = FTR_TeamA - FTR_TeamB
After an initial glance at the "NET 4 Factors", we decide whether a more in-depth analysis is required. It's crucial not to rely solely on "NET 4 Factors" analysis, as high values could be due to high offensive factors or low defensive factors.
Correlation
But what's the correlation between the "NET 4 Factors" and the net rating of a game? For this, we can use a machine learning technique called multiple linear regression.
With regression, we obtain an equation of the following form and a parameter called R². The R² tells us how closely our model aligns with reality, in other words, it indicates if there's a correlation.
Weight of Each Metric
Dean Oliver quantified the weight of each "4 Factor" for the NBA as follows:
eFG%: 40%
Off.R%: 20%
TO%: 25%
FTR: 15%
Since each competition and season has different characteristics, we'll compare the following leagues and seasons:
Leb Oro 2021-2022 (Spain)
Leb Oro 2022-2023 (Spain)
Liga Femenina 2021-2022 (Spain)
Liga Femenina 2022-2023 (Spain)
BBL 2021-2022 (UK)
BBL 2022-2023 (UK)
League A1 2021-2022 (Greece)
League A1 2022-2023 (Greece)
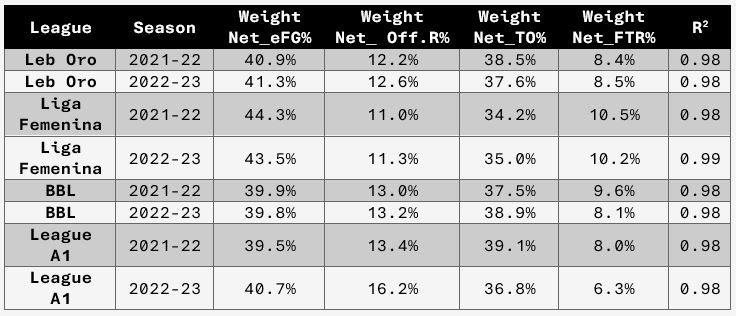
We've analysed every game in these leagues. The table below summarises the weight of each "NET 4 Factor" and the R² for each league and season.
Conclusions
From this analysis, we can draw the following conclusions:
It's essential to analyse each league before the season begins to gain perspective on which metrics are crucial.
After analysing four leagues across two different seasons, it's evident that there's significant similarity in the results. The most important metrics are Net_eFG% and Net_TO%. Therefore, focusing on improving the mentioned metrics is recommended.
To enhance Net_eFG% and Net_TO%, it's recommended to collect results from each play or game situation. This will help quantify which plays or game situations are most effective (eFG%) and which result in fewer turnovers (TO%). This insight will guide us in understanding which plays or game situations need more work to maximise results. The same approach can be applied to defensive situations.
At Basketball Analytics Lab, we offer data analytics services to clubs, enabling them to enhance their performance without significantly increasing their budgets.
Feel free to share and comment if you found this article interesting.
Where Data Meets the Hoops - Let's Analyse the Game Together!
Oliver, D. S. (2003). Basketball on Paper: Rules and Tools for Performance Analysis.


I’ve had this book for over ten years. Great read, coach, Payer or fan